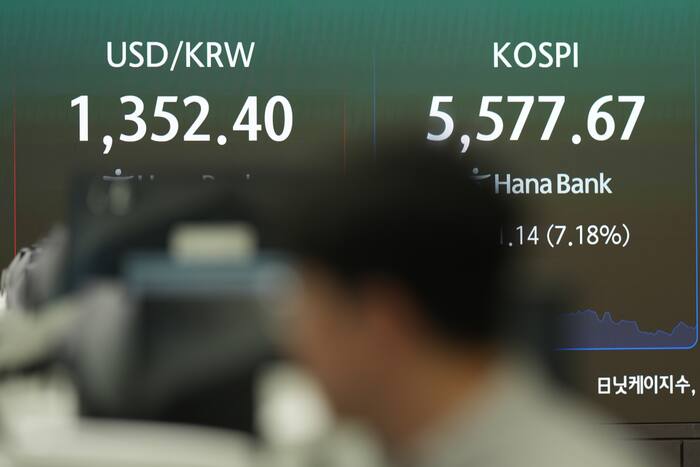
Headline coverage of Asian equity sell-offs frequently treats regional index drops as passive aftershocks of Wall Street volatility, yet Asian tech stocks often fall faster and harder than their American counterparts because they sit at the chokepoints of capital-intensive hardware supply chains. A deeper tech sell-off dragging Asian equities lower—with South Korean and Japanese benchmarks leading the decline—exposes a structural vulnerability: regional markets carry concentrated exposure to cyclical semiconductor, memory, and precision component manufacturing paired with high foreign institutional liquidity. Understanding why South Korea and Japan stock markets react so violently requires separating three analytical layers: the transmission mechanics of global technology repricing, the asymmetric operating structure of East Asian hardware exporters, and the positioning dynamics that turn routine valuation resets into forced regional liquidations.
This analysis provides a diagnostic blueprint for institutional allocators, corporate strategists, and market observers seeking to separate structural supply-chain deterioration from liquidity-driven drawdowns. Rather than relying on surface-level index moves, the framework below maps how global technology multiple compression propagates into East Asian equities, why semiconductor and tech equities in Seoul and Tokyo face distinct earnings sensitivities, and how to evaluate risk when headlines point to a widening regional rout. Don't miss our recent post on this related article.
The Three Transmission Channels of a Global Tech Correction
Surface-level commentary often reduces a regional equity drop to simple correlation: US technology stocks fall overnight, so Asian markets open lower. In practice, three distinct transmission channels govern how aggressively a global technology sell-off hits Asia.
The first channel is duration and discount-rate repricing. High-growth technology equities derive a large share of their present value from distant cash flows. When real yields rise, inflation expectations firm, or risk appetite contracts, equity risk premia widen and long-duration multiples compress. While mega-cap platform companies in the United States often buffer multiple compression with recurring software revenue, high cash balances, and pricing power, hardware-heavy supply chains across Asia experience simultaneous pressure on both valuation multiples and near-term unit economics. To read more about the context of this, Business Insider offers an excellent breakdown.
The second channel is capital expenditure (CapEx) signaling. Much of the recent expansion across East Asian electronics and chipmakers has been anchored to hyperscaler and enterprise infrastructure spending. When investors question the return on invested capital (ROIC) of massive AI and data-center outlays, markets reprice upstream equipment, wafer, and component suppliers ahead of actual order cancellations. Equity markets discount order-book deceleration long before quarterly revenue reports reflect slower shipments.
The third channel is cross-border liquidity and currency feedback. Global asset managers frequently treat liquid Asian benchmarks as a source of immediate cash during risk-off episodes. When global funds trim exposure or face redemption pressure, selling liquid large-cap exporters in Seoul and Tokyo raises cash quickly. Currency moves compound the effect: a strengthening Japanese yen or a volatile South Korean won alters translated earnings expectations and pressures carry trades, reinforcing equity outflows.
Distinguishing Known Mechanics from Educated Hypotheses
Rigorous market analysis requires separating observable structural mechanisms from educated hypotheses that cannot be verified without live transaction and order-book data.
Known structural facts include:
- East Asian equity benchmarks have heavy index weights in hardware manufacturing, semiconductors, precision machinery, and export-oriented industrials compared with broader global indices.
- Foreign institutional investors hold substantial shares of liquid large-cap names in markets such as South Korea, making those shares sensitive to global risk-on/risk-off swings.
- Semiconductor and electronics supply chains exhibit pronounced inventory and capital-spending cycles.
Educated hypotheses—plausible explanations for a specific sell-off that require empirical verification—include:
- Whether a given drawdown reflects genuine end-demand softening versus a positioning washout after crowded long trades.
- Whether hyperscaler CapEx scrutiny is translating into delayed deliveries at specific Asian foundries, memory producers, or component vendors.
- Whether domestic retail or derivative hedging flows in South Korea or Japan are accelerating intraday index swings beyond cash-equity fundamentals.
Why South Korea and Japan Anchor Regional Tech Drawdowns
When Asian markets sink during a tech pullback, South Korea and Japan frequently sit at the center of the move because their industrial specializations occupy opposite—yet complementary—ends of the hardware value chain.
The High-Beta Operating Leverage of South Korea
South Korea's equity market is structurally tilted toward memory semiconductors, display panels, and integrated electronics conglomerates. Memory chips are largely standardized commodities governed by supply-demand balance, wafer capacity discipline, and inventory cycles. That structure creates powerful operating leverage:
- Fixed-cost intensity: Fabrication plants require massive upfront capital outlays and continuous cleanroom operation, meaning utilization rates strongly influence unit costs.
- Price convexity: Tight supply paired with surging demand—such as high-bandwidth memory (HBM) or server DRAM—can drive rapid average selling price (ASP) gains and sharp margin expansion. Conversely, even modest shifts in inventory or customer order pacing can trigger abrupt pricing pressure and multiple compression.
- Index concentration: Because a small number of mega-cap hardware names represent a large share of benchmark capitalization, steep declines in those leaders pull the broader market down rapidly.
The Precision Supply and Capital-Equipment Role of Japan
Japan's contribution to the global technology stack centers on semiconductor manufacturing equipment (SPE), specialty chemicals, electronic materials, factory automation, and precision components. Rather than competing primarily in high-volume consumer assembly, many Japanese firms supply the bottleneck tools and inputs required to fabricate advanced chips and build automated production lines.
This position creates a distinct risk profile during a tech sell-off. Capital equipment makers sit earlier in the CapEx cycle than end-device assemblers, meaning their valuations reflect expectations about multi-quarter factory buildouts. When global investors reassess the pace of fab expansion or industrial automation spending, equipment and materials stocks often experience sharp swings driven by changing order-intake expectations. In addition, yen fluctuations directly affect export competitiveness and overseas profit translation, adding a macro variable that US hardware peers do not face in the same way.
Why Other Asian Hubs Behave Differently
Comparing South Korea and Japan with other major Asian markets highlights why a single regional narrative often blurs crucial differences:
- Taiwan shares intense semiconductor concentration—especially in leading-edge foundry manufacturing and packaging—making it a primary bellwether for global chip demand and AI server supply chains.
- Mainland China and Hong Kong reflect a different mix of domestic policy cycles, property and consumer dynamics, platform regulation, and localized hardware self-sufficiency efforts alongside global export exposure.
- Southeast Asian markets generally carry lower direct weight in cutting-edge semiconductor fabrication and act more as assembly, testing, or broader regional cyclicals.
Treating "Asian stocks" as a monolith obscures where true fundamental stress resides versus where index weights simply amplify global tech beta.
The Cost Function and Bottleneck Economics of Hardware Tech
To evaluate whether a sell-off in semiconductor and tech equities represents a temporary valuation reset or the start of an earnings downturn, analysts should examine the cost function and bottleneck economics of hardware production.
Unlike software—where marginal distribution costs approach zero and gross margins are high—hardware manufacturing is governed by physical capacity constraints, yield curves, and capital intensity. A firm's cost function depends on fixed depreciation and maintenance expenses, variable raw materials and energy, and yield (the percentage of functional units produced per wafer or batch).
When new process nodes or advanced packaging lines scale up, early yield challenges can constrain effective supply even when headline capacity looks large. Conversely, once yields mature and capacity expands across the industry, pricing power can shift quickly if demand growth moderates. A sell-off triggered by multiple compression looks very different from one driven by deteriorating unit economics:
- Multiple-led drawdowns occur when earnings forecasts remain intact or grow, but investors pay a lower price-to-earnings or enterprise-value-to-EBITDA multiple due to higher discount rates or risk aversion.
- Earnings-led drawdowns occur when order backlogs shrink, customer inventories build up, pricing weakens, or CapEx plans are cut, forcing downward revisions to consensus revenue and margin estimates.
Confusing the two leads to costly mistakes: buying an earnings-led downturn early can trap capital in a falling-knife revision cycle, while selling a multiple-led pullback after fundamentals hold firm can lock in losses near a trough.
Tactical Diagnostic Framework for Navigating Tech Sell-Offs
A disciplined response to a deepening technology and Asian equity sell-off relies on structured verification rather than headline reaction. The following sequence outlines how an analyst or portfolio manager can diagnose the move systematically:
- Decompose price action into multiple vs. earnings signals. Compare recent share price declines against near-term earnings revisions, order commentary, and customer CapEx guidance. If price falls sharply while forward estimates stay steady, multiple compression or positioning unwinds are doing heavy lifting.
- Map position along the supply chain. Separate upstream bottleneck suppliers (equipment, specialty materials, leading-edge foundry and memory leaders) from downstream components and consumer-exposed hardware. Check where customer inventory days are rising and where lead times are compressing.
- Isolate currency and cross-border flow effects. Track local-currency returns alongside US-dollar or base-currency returns, and watch major currency pairs such as USD/JPY and USD/KRW. A sharp move in local exchange rates can distort unhedged performance and signal cross-asset de-risking.
- Stress-test balance sheets and CapEx flexibility. Review net cash or debt maturities, free cash flow conversion, and how much planned capital expenditure is committed versus discretionary. Companies with strong balance sheets and flexible CapEx can weather downturns and gain share; highly leveraged firms face sharper downside if cash flows tighten.
- Audit concentration and correlation risk. Check how much of a portfolio's drawdown comes from overlapping tech and hardware exposures disguised under different geographic or thematic labels.
Limitations and Failure Modes of Analytical Frameworks
No analytical framework eliminates market risk, and every structured model has clear blind spots:
- Lagging indicators: Financial statements and official trade figures report past periods, whereas equity prices discount forward expectations in real time.
- Exogenous shocks: Sudden geopolitical escalations, export-control shifts, natural disasters, or abrupt central bank policy pivots can override historical correlations and valuation norms.
- Liquidity illusions: In fast markets, correlations across asset classes often converge toward one in the short term, making diversification appear ineffective until forced selling subsides.
- False precision: Applying neat categories to messy real-world tape can create overconfidence if an analyst treats an educated hypothesis as proven fact.
Strategic Play for Capital Allocation
Do not chase broad Asian index bounces or panic-sell quality hardware franchises on day-one volatility; instead, stagger capital deployment into cash-generative supply-chain leaders only after forward earnings estimates stabilize and customer inventory signals stop deteriorating, while sizing positions to survive further currency and multiple swings. Use sharp tech-driven pullbacks in South Korea and Japan to audit portfolio concentration, separate true bottleneck moats from cyclical commodity exposure, and keep dry powder ready for dislocations where price detaches furthest from long-term cash-flow durability.